Visualizations in FaceBase Data
The FaceBase system includes pipelines that convert data of a specific resolution and format into helpful visualizations that can deepen a user’s experience with the data. Such visualizations include: Image Volumes, Histology/Annotations, Surface Mesh and Single Cell viewers.
Recommended video “Imaging Data in FaceBase”:
Image Volume Viewer (3D images)
Some imaging data is created in three dimensions, which is useful in understanding the shape and size of specific anatomical regions of the face and skull, for example when comparing control specimens with mutant specimens.
Where a 3D image has been contributed, FaceBase provides a downsampled 3D preview inside your browser window.
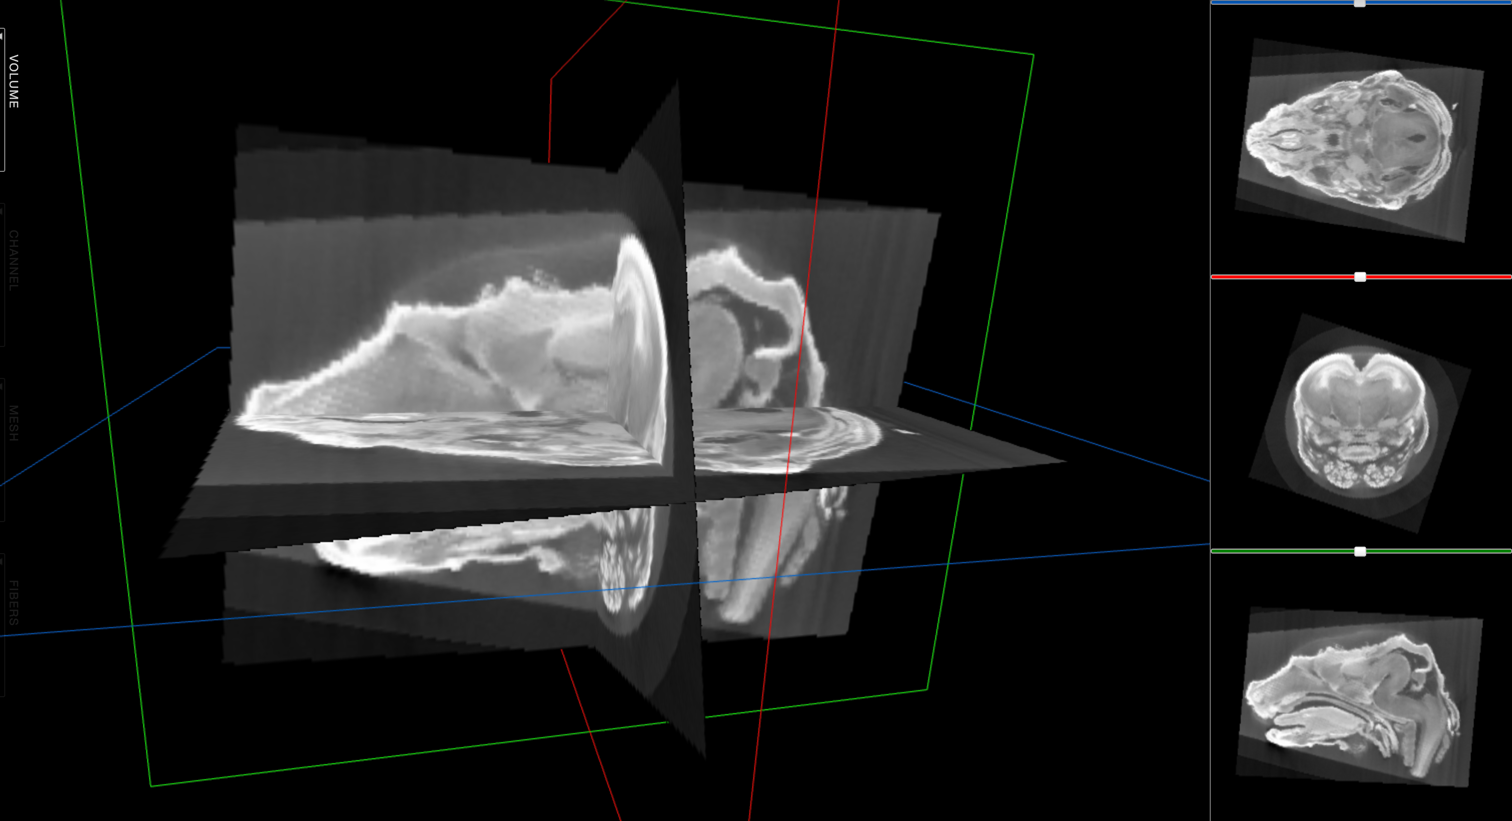 Figure 1: What a 3D image looks like rendered by our imaging pipeline.
Use the following dataset to try it out - TKT - microCT - Soft Tissue of Msx1 Control Mice at E16.5:
- Scroll down to the Downsampled Image Previews section.
- You have the option to click the Full Screen button for a larger view.
- Click the Click here to load image button.
- Once the image loads, you can make many adjustments, including:
- Use your mouse to turn the 3D image in all directions and to zoom in and out.
- The panels on the right side provide different views of the image. Use the sliders in each panel to step through slices of the image.
- On the left side, hover over the “Volume” label to open the Volume panel where you can adjust the levels or brightness of the planes to virtually examine the structures in the image.
Check out this video that demonstrates how to use the Image Volume Viewer:
Histology/Annotations Viewer (2D images)
Two dimensional images in the FaceBase repository are commonly histological (stains are used to show regions where a gene is expressed). Our pipeline accepts the raw image file from a microscope and converts it into an image may be viewed in a web browser page (Figure 2).
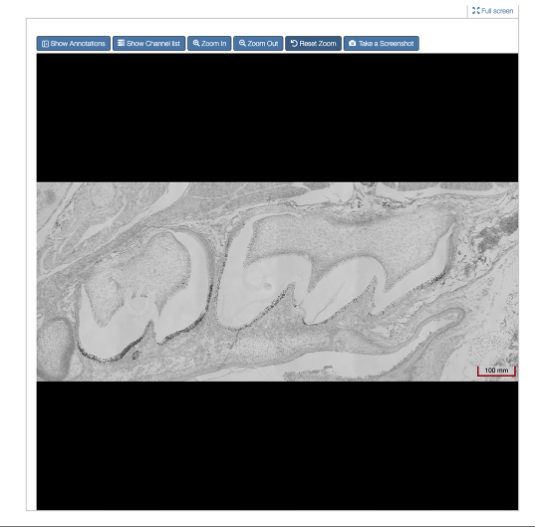 Figure 2: Example of 2D image in default view (Scale at 100mm)
The viewer is like an online, digital microscope, allowing the user to zoom in for a deep view of the image (depending on the resolution of the image - the higher the resolution, the more deeply you can zoom in, see Figure 3 below).
To download a screenshot of the current view that includes an accurate scale, click Take a Screenshot. This is ideal for use in publications and presentations.
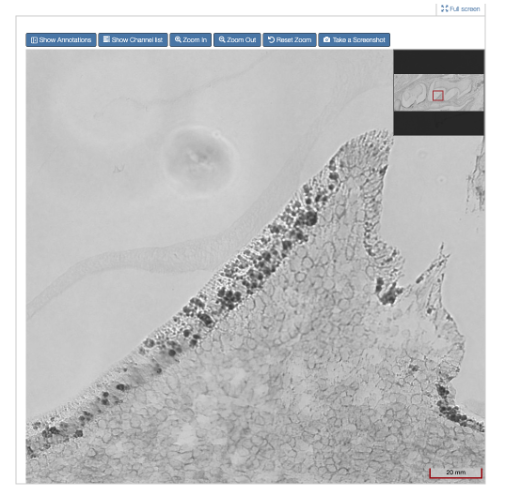 Figure 3: Example of the same image zoomed in (Scale at 20 mm)
Use the following dataset as an example: 1-SXC4 - Histology and schematic overview of mouse molar root development:
- Scroll down to the Imaging Data section (or use the links on the left side of the page)
- Click View for one of the imaging records.
- Click Full screen to enlarge the viewer.
Annotations
Our 2D viewer also supports annotations of anatomical regions in an image (see Figure 4).
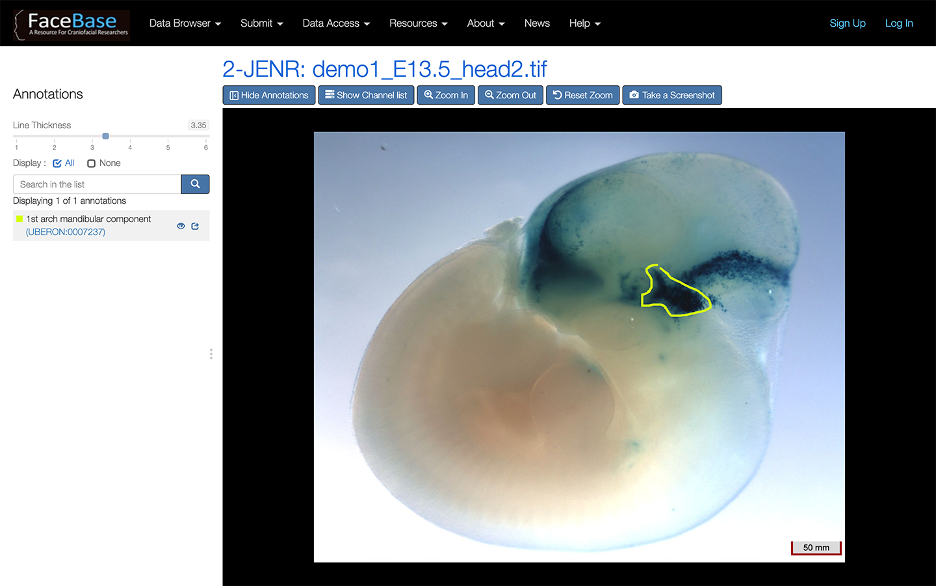 Figure 4: Example of an annotated image
Annotations link to the corresponding FaceBase anatomy page for that region, which displays more information on the region and lists any related data in the FaceBase repository.
To see if an image already has annotations, click Show Annotations.
Data contributors can use editing tools to mark a colored boundary around specific anatomical regions on an image, label them (see Figure 5). Click here for documentation on annotating images.
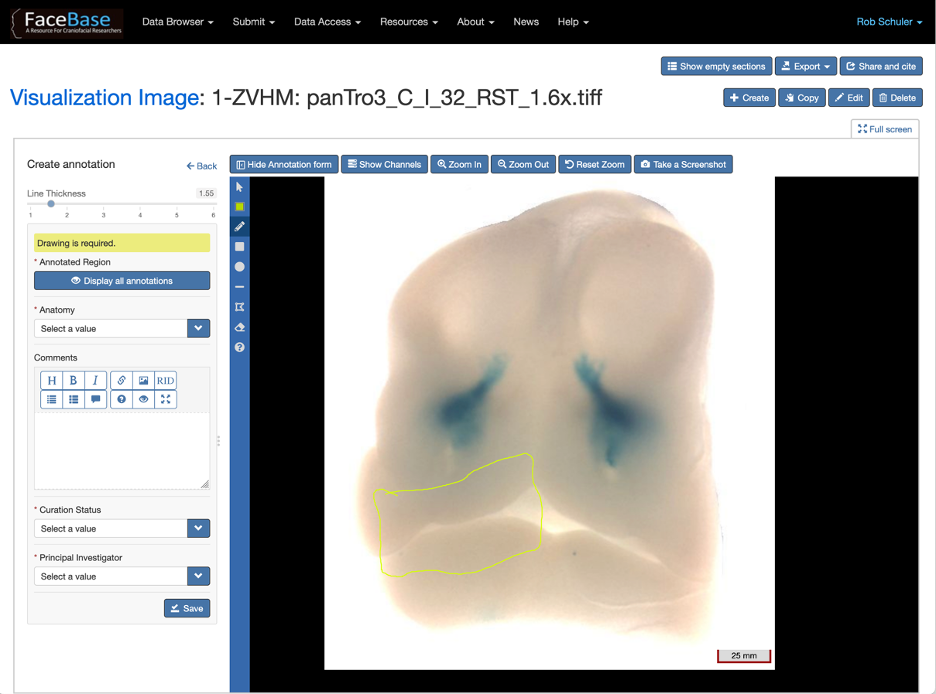 Figure 5: Example of the Annotations Editor
Surface Mesh Viewer
If a contributor provides surface mesh data - which depicts surfaces of interest - our Surface Mesh Viewer can create a ‘jigsaw puzzle’ effect where each surface mesh object is given its own color and channel, which can be toggled on and off (see Figure 6).
 Figure 6: Example of the Surface Mesh Viewer
Surface meshes may be annotated with anatomical landmarks demarcating specific locations on a specimen. The distance between landmarks can also be calculated.
This educational tool is especially powerful for new researchers to learn anatomical regions.
Use the following dataset as an example: 3V4A - E18.5 wildtype mouse microCT
- Scroll down to the 3D Surface Models section.
- Click Full Screen if you’re on a smaller display.
- Use the following buttons to explore the image: Zoom In, Zoom Out, Rotate.
- Click Meshes to open a panel of anatomical regions identified in the image.
- Click the colored dots to toggle visibility on and off for that region.
- Click an anatomical term to open the related Anatomiy page that lists all related datasets.
View all available Surface Mesh Model imaging data available in FaceBase.
Check out this video that demonstrates how to use the Surface Mesh Viewer:
Single Cell Viewer (scRNA-Seq)
Unique to FaceBase is the ability for contributors to upload their sequencing data and receive a processed visualization of their data (see Figure 7).
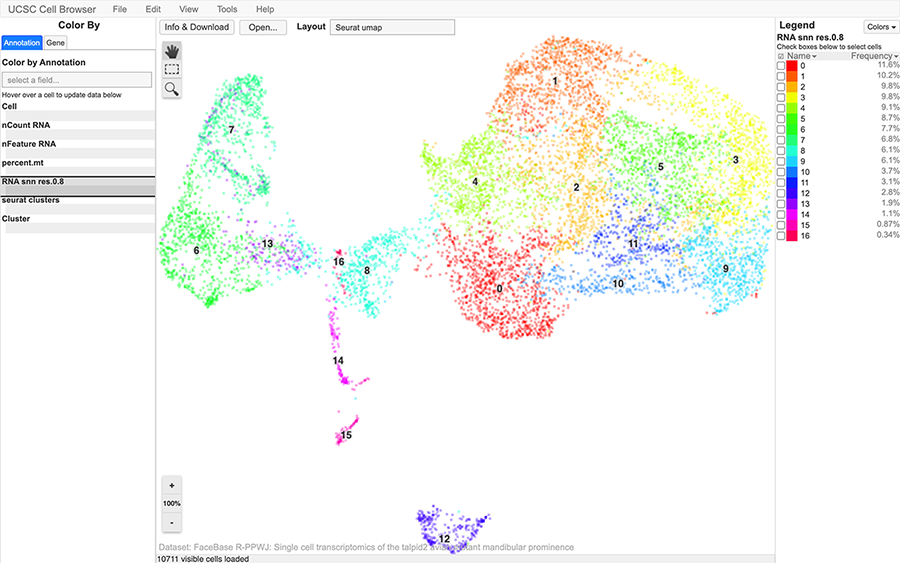 Figure 7: Example of the Single Cell Viewer
Single-cell RNAseq data from FaceBase datasets can be visualized by the UCSC Cell Browser and interactive viewer for single cell expression, where you can easily identify cell clusterings and gene-expression patterns.
Use the following dataset as an example: 1-YSFP - Single cell transcriptomics of the talpid2 avian mutant mandibular prominence
- Scroll down to the Processed Data section and browse the rows.
- Rows for R data (such as a Seurat object) display a thumbnail of a scatter plot. Click View Details for one of these rows.
- When you open the record, scroll to the Cell Browser area to view the embedded UCSC Cell Browser viewer for this data. You can click Full Screen for a larger presentation if you’re using a laptop, for example.
- Access the Interactive Tutorial: At the menu at the top of the viewer, click Help and then Tutorial.